Troubleshooting Your Deploy
Resolve issues deploying and running on Render.
If your Render service fails to build, deploy, or run, follow this guide to help resolve the issue.
Always start with the first three steps below. They'll help you identify your issue's root cause, along with the issue type:
| Issue type | Description |
|---|---|
|
Build issue |
These issues occur while Render is building a new version of your service, before it's deployed. |
|
Runtime issue |
These issues occur while your deployed service is starting up or actively running. |
If your issue isn't covered in the sections below, we also recommend consulting your coding agent, searching the web, or asking in Render's official Discord community.
First three steps
1. Check the logs
Start every investigation by checking your service's logs. Do so in any of the following ways:
Render Dashboard
Service logs are available in the Render Dashboard:
-
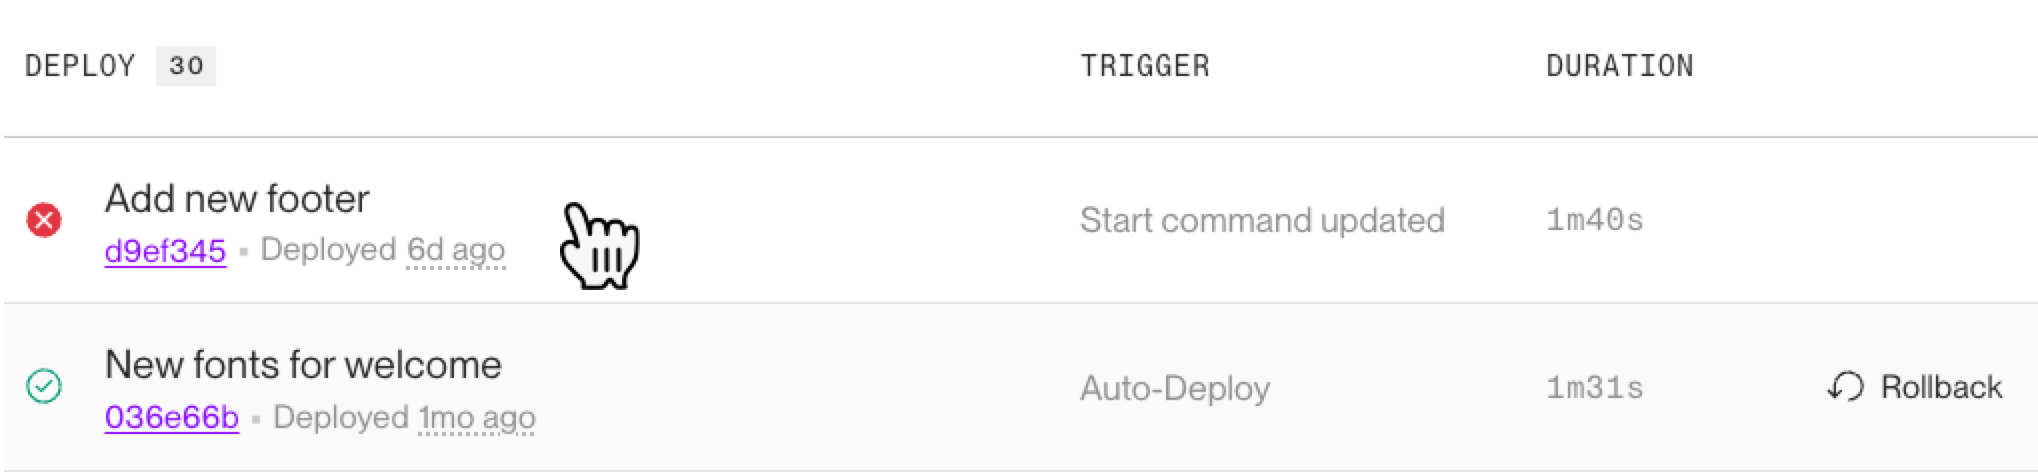
If a particular deploy fails, view its logs by selecting that deploy from your service's Deploys page:
-
If a running service encounters an issue, open its Logs page to view, search, and filter runtime logs:
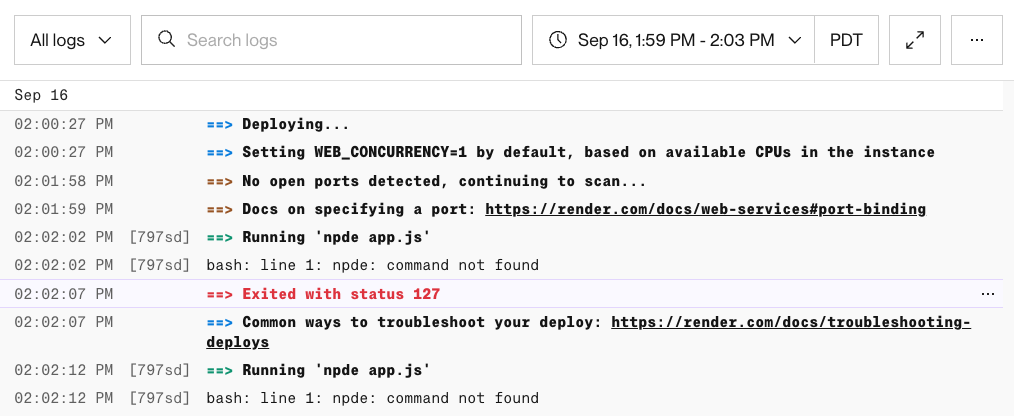


Start by filtering for log lines with level: error to help identify the most likely cause.
For more details, see Logs in the Render Dashboard.
Render MCP server
The Render MCP server provides tools for fetching and filtering service logs. After you connect your coding agent (Codex, Claude Code, etc.), it can use these tools to rapidly diagnose a wide range of common issues.
Render CLI
Use the Render CLI's logs command to view logs for your service.
-
For interactive mode, run the command without options to select your service from a menu and apply filters:
-
For non-interactive mode, provide your service's ID with the
--resourcesoption:You can filter results by time, log level, text, and other attributes. For example, this command finds error-level logs from a specific time range:
For all supported options, see the Render CLI reference.
If you spot any error-level logs, proceed to the section that most closely matches the issue based on the error's details. You can also provide these details to your coding agent for help diagnosing the issue.
2. Check the metrics
Render provides a variety of performance metrics for your service. In the event of a performance issue, these metrics can help identify the root cause and when it started.
Render Dashboard
Open your service's Metrics page in the Render Dashboard to view metrics related to CPU/RAM usage, incoming requests, and more:

For details, see Service Metrics.
Render MCP server
The Render MCP server provides a tool for fetching service metrics. After you connect your coding agent (Codex, Claude Code, etc.), it can use this tool to rapidly diagnose a wide range of common issues.
If you observe a spike in a particular metric (such as CPU/RAM usage or incoming requests), proceed to the section below that most closely matches the issue.
It's also helpful to cross-reference your metrics with your logs and your recent deploy activity to determine whether the issue coincides with a recent change.
3. Check the event history
Your service's Events page in the Render Dashboard can help you view issue patterns across multiple deploys. This page displays a timeline of significant activity, such as deploy failures, instance restarts, and maintenance:

Build issues
Build issues occur while Render is building a new version of your service, before that version is deployed. These issues usually arise during the execution of your service's build command.
If your application builds correctly on your local machine but fails to build on Render, it's almost always due to one of the issues below.
Wrong language runtime
While creating a service, you choose the native runtime that corresponds to your app's language (such as Node or Python). Render also provides Docker-specific runtimes for building from a Dockerfile or pulling a prebuilt image.
- Check your service's runtime from the service's page in the Render Dashboard.
- If your service is using the wrong runtime for its language, change its runtime with these steps.
Mismatched versions
Render and your local machine might be using different versions of your app's programming language or dependencies:
| Mismatch | Description |
|---|---|
|
Language version |
Render sets a default language version for each native runtime. This default likely differs from the exact language version you use locally. For all native runtimes besides Go, you can specify an exact language version to use. See details for each runtime: |
|
Dependency versions |
Render might be using a different version of your app's dependencies than you use locally. Perform a fresh install of your project on your local machine to confirm that you're using exactly the dependency versions specified in your repository (such as in your |
Invalid or missing configuration
As part of creating a Render service, you apply a variety of configuration settings, including:
- The commands Render uses to build and start your app
- The values of environment variables your app reads both during builds and at runtime
Your service can fail to build if it's missing any required configuration, or if its configuration is invalid. Common examples include:
| Issue | Description |
|---|---|
|
Invalid build command |
Make sure the build command matches the command you use to build your app locally. Common examples include:
|
|
Invalid pre-deploy command |
If you've set a pre-deploy command, make sure it's valid as well. Common examples include:
|
|
Invalid Git provider credentials |
If your Git provider credentials are expired or otherwise invalid, Render can't access your repository to pull the latest version of your app. Verify your Git deployment credentials. If they're missing or no longer valid, replace them. |
|
Missing or incorrect environment variables |
On your local machine, your app might read environment variables from a If you're using Blueprints, you can also add environment variables to your service's Blueprint file. Do not hardcode sensitive values in your Blueprint file. |
|
Missing build tool |
Any tool invoked by your build command must be available in Render's build environment. For a list of available and commonly used tools, see Tools and utilities. If the build environment doesn't include a tool or dependency your app needs, you can install it as a preliminary step in your build command. |
Common error messages
Missing resources
These errors occur when Render can't locate a file or dependency your app requires:
| Error | Description |
|---|---|
|
|
Usually indicates one of the following:
|
Incompatibility errors
These errors occur when your app's language version is incompatible with its code or dependencies:
| Error | Description |
|---|---|
|
|
The app's Node.js version doesn't support the indicated operator or method. |
|
|
The app's Node.js version doesn't work with the specified module. |
|
|
A dependency isn't compatible with the app's Python version. |
Build process errors
The following errors can also cause your build to fail:
| Error | Description |
|---|---|
|
|
Your workspace used all of its monthly build pipeline minutes. To resume builds, raise your spend limit or wait for next month's refresh. |
|
|
Your build exceeded its available memory. For details on memory limits while building, see Pipeline tiers. |
|
|
Your application exited or crashed while building. See the exit code to identify the cause. |
|
|
Your build did not finish within the allowed time. Check your logs for slow dependency installation, network requests, or stalled commands. |
Runtime issues
These issues occur while a deployed service is starting up or actively running.
Startup failures
These are errors that occur while Render is starting up a newly deployed instance of your service, preventing it from going live.
| Issue | Description |
|---|---|
|
Invalid start command |
Make sure your start command is valid. This usually matches the command you use to start your app locally. Common examples include:
|
|
Missing Dockerfile |
If you're building from a Dockerfile, make sure that your Dockerfile includes the If you omit both of these directives, your deploy might appear to hang in the Render Dashboard. |
|
Misconfigured health checks |
For web and private services, a new instance only starts receiving requests after it starts up successfully and passes health checks. For details, see Health check errors. |
|
|
Render failed to detect at least one open port on your service's host before its scan timed out. This error is specific to web services and private services. Common causes include:
|
|
|
Your instance ran out of memory during startup. See Memory exhaustion. |
|
|
Your application exited or crashed during startup. See the exit code to identify the cause. |
|
|
Your instance was not ready before the deploy timed out. Common causes include:
|
|
|
Render couldn't pull your image from the external registry. For details, see Image pull failures. |
Instance failures
An Instance Failed event occurs when your service's application exits unexpectedly, or when Render restarts it after repeated health check failures. Render automatically manages the instance lifecycle. Avoid manually terminating or restarting a failed instance as part of troubleshooting.
If your application exits unexpectedly, the event might include an exit code to help identify the cause.
If your service restarts due to health check failures, the event can include connection refused or i/o timeout errors. To determine the cause of the error:
- Check your logs before the failure for crashes, timeouts, or API and database errors.
- Check your service metrics to ensure you're not experiencing memory or CPU exhaustion.
Maximizing service availability
A properly configured service can remain responsive even while experiencing intermittent issues. Read Best Practices for Maximizing Uptime for guidance on instance scaling, retry logic, and other strategies for maintaining availability.
Health check errors
Render sends periodic health checks to web and private service instances to confirm they're healthy and able to receive traffic.
By default, health checks are TCP socket probes to one of your service's open ports. Web services can optionally add custom HTTP health checks to verify application-level readiness.
Render performs health checks as part of the deploy process and as part of the ongoing operation of a live service:
- During a deploy, failed health checks prevent new instances from going live. See Startup failures.
- On a live service, repeated health check failures trigger an automatic restart. See Instance failures.
For details on how Render responds to failed health checks on new deploys vs. actively running services, see Handling failures.
HTTP health check failures
A custom HTTP health check can fail during startup or while running, emitting an event with one of the following errors:
| Error | Description |
|---|---|
|
|
Your health check timed out. Check your instance's CPU and RAM usage to confirm you're not experiencing memory or CPU exhaustion. We recommend a simple health check, such as a basic database query, to avoid the check itself timing out. |
|
|
Your health check endpoint returned a status code outside the Send a request to the endpoint and confirm the returned status code is healthy. Check your logs to see if there are HTTP error codes. |
If you can't isolate your HTTP health check's repeated failures, consider temporarily removing it to keep your instances running. Render then falls back to the default TCP check.
Instance evictions
Render might automatically evict and replace instances that are unhealthy, or whose underlying infrastructure is unhealthy. A replacement instance spins up on its own and typically requires no action.
Repeated instance evictions can indicate that your service is exceeding the storage limit of its ephemeral filesystem. In this case, you can attach a persistent disk to increase available storage or write to a separate datastore, such as Render Postgres.
Memory exhaustion
When your service runs out of available memory while deploying or running, it can emit an event including an Out of memory (OOM) error.
An especially abrupt crash from a sudden memory spike might not appear in your service metrics.
Common causes of memory exhaustion include:
| Issue | Description |
|---|---|
|
Increased traffic |
If your instance's memory usage spikes with increases in inbound traffic, consider scaling your service. |
|
Memory leak |
Memory usage that climbs steadily until the instance crashes typically indicates a leak. Memory leaks are usually caused by a code or configuration issue. If the pattern started after a specific deploy, try rolling back to a version from before the issue started. |
|
|
Render can set a default If the default concurrency is too high for your app, your instance might run out of memory. Set a lower concurrency to reduce memory pressure. |
|
JVM-based apps deployed via Docker |
By default, apps written in Java, Kotlin, and Scala are memory-intensive. We recommend upgrading your service to the |
|
Node.js AI workflow tools |
Tools such as n8n and Flowise are memory-intensive by default. We recommend upgrading your service to the |
|
Node.js heap limit too low |
If your instance logs Set For example, if your instance has 4 GB of RAM, you'd set |
|
Application memory usage |
If your instance’s memory usage spikes without a corresponding increase in inbound traffic, your application's behavior (such as background work, caching, or memory retention) might be contributing. Add logging or monitoring to track memory usage and help identify when spikes occur. For complex issues, consider using an Application Performance Monitor (APM). |
CPU exhaustion
CPU exhaustion occurs when your service exceeds its CPU limits while deploying or running. Review your service's metrics to diagnose CPU issues.
CPU exhaustion can lead to other issues, such as health check errors and memory exhaustion.
Common causes of CPU exhaustion include:
| Issue | Description |
|---|---|
|
Increased or spiking traffic |
If your instance's CPU usage climbs with sustained increases in inbound traffic, consider scaling your service. For sudden traffic spikes, run load tests with burst-like traffic to choose a compute plan that handles your service's peak demand without exceeding limits. |
|
Stuck workers or threads |
Long-running database queries and API calls can reduce throughput and spike CPU usage from retries. Keep workers from becoming overloaded by:
|
|
Inefficient Postgres queries |
Slow queries, lock contention, or missing indexes can increase your Postgres instance's CPU usage. |
|
Concurrent one-off jobs |
Running too many one-off jobs at once can cause your instance's CPU usage to spike. Trigger jobs in smaller, staggered batches to reduce peak CPU demand. |
Exit codes
If your service's application exits, Render might include its exit code in the corresponding Deploy Failed or Instance Failed event.
Common exit codes include:
Exit code 0
Your app exited "successfully" but early. Web services, private services, and background workers all run continuously and should never exit unless they receive a SIGTERM signal.
For workloads that exit after their task is complete, use a workflow or cron job instead of a continuously running service type.
Exit code 2
Render encountered an error while running a service's build, pre-deploy, or start command. Check each command's syntax, formatting, and arguments to identify the issue.
For details, see Deploy steps.
Exit code 137 (SIGKILL)
A process was forcefully terminated. Common causes include:
- Your service did not shut down gracefully when Render restarted it because of repeated health check failures.
- Server timeouts or worker limits that force repeated termination under load.
- Exhausting an instance's CPU or RAM.
- Check your service metrics for usage.
Exit code 139 (SIGSEGV)
Your app attempted to access memory without proper permissions, causing a segmentation fault. Common causes include:
- Invalid memory access in your app or one of its native dependencies or extensions.
- Insufficient memory, which exposes latent memory-access bugs. See Memory exhaustion.
HTTP error codes
Many common runtime issues surface as HTTP error codes returned to your browser or other client. For browser errors, the Network panel of your browser's developer tools shows error details.
The most common error codes are:
400 Bad Request
Your service received an invalid request. Common causes include:
- The request is missing required parameters.
- An API endpoint expects a
JSONrequest body, but receivesHTMLor another format instead. - A request's URL is malformed or incorrectly encoded.
A 400 error also occurs when a Django app doesn't include its associated custom domain in its ALLOWED_HOSTS setting.
404 Not Found
Your service can't find content at the specified path. Common causes include:
- A static site's redirects and/or rewrites are misconfigured.
- A service has disabled its
*.onrender.comsubdomain. - A web service or static site has misconfigured routing, or there isn't a route matching a request's path.
- A service is attempting to access a non-existent file on disk. This can happen if:
- A file was stored in Render's ephemeral filesystem and is no longer available. You can fix this by storing files on a persistent disk.
- A request specified an incorrect file path.
- A Django app is not correctly serving its static files.
429 Too Many Requests
Your service is rejecting requests due to rate limiting. Common causes include:
- A third-party API is rate limiting your service's outbound requests.
- This is outside of Render's control. Consult the third party's documentation for guidance.
- Render is rate limiting inbound requests to your service. This can occur if:
- Render is mitigating a DDoS attack.
- Your service is hitting Render's rate limits for inbound traffic, which are significantly lower for free services.
- Render's REST API is rate limiting your requests.
- See the API reference for details.
- Your application's rate limiter is counting custom health checks, which Render sends every few seconds.
- Make sure your rate limiter excludes your custom health check path.
500 Internal Server Error
Your service had an internal error while responding to a request. Common causes include:
- An uncaught exception while responding to a request, causing your service to crash or restart.
- Use logging and error handling to isolate your error.
- Your service is experiencing unstable connection issues to your Render Postgres instance, such as
SSL connection has been closed unexpectedly. To fix these, you can:- Add
sslmode=requireto your database connection string to ensure a secure connection. - Set up a connection pool to reduce connection churn.
- Add
- Your service or database is overwhelmed by too many concurrent connections or constrained resources (CPU/RAM).
- See Memory exhaustion and CPU exhaustion for more specific guidance.
502 Bad Gateway
Your service isn't able to handle a request. Common causes include:
- Your service has never had a successful deploy.
- Your service's only instance is failing repeated health checks. See Health check errors.
- Your web service has misconfigured its host and port.
- Bind your server to
0.0.0.0and the port specified by thePORTenvironment variable, which defaults to10000.
- Bind your server to
- A new custom domain isn't redirecting to a web service yet.
- DNS changes usually propagate in a few minutes, but can take up to an hour.
- Your Node.js web service has intermittent timeouts or
Connection reset by peererrors.- Increase the values for your server's
keepAliveTimeoutandheadersTimeoutsettings. For details, see the Node.js documentation.
- Increase the values for your server's
- Your service's logs show
WORKER,SIGKILL, orSIGTERMwarnings, such as[CRITICAL] WORKER TIMEOUT.- Increase your server's timeout setting to give workers more time to respond before they're killed. For example, in a Python app, adjust the Gunicorn
timeoutparameter. - If your service's process was killed with exit code
137, see Exit codes below.
- Increase your server's timeout setting to give workers more time to respond before they're killed. For example, in a Python app, adjust the Gunicorn
503 Service Unavailable
Your service is temporarily unable to serve requests. Common causes include:
- Your service has been suspended.
- You suspended the service, or Render suspended it due to billing, platform, or free plan limits.
- A free service is spinning up from idle.
- Render displays a loading page while your service starts, and deploy logs appear once the spin-up is complete.
- A service is in maintenance mode.
When to contact support
Our support team is available and happy to assist with issues that pertain to the capabilities, conventions, and underlying infrastructure of the Render platform.
Our support team is not able to assist with issues specific to your application's code, such as:
- Application-level debugging and optimization
- Software architecture and design
- Library- and framework-specific behaviors
For help with issues like those above, please consult resources that specialize in these forms of assistance.
For issues specifically related to the Render platform, reach out to our support team in the Render Dashboard.